# Attenuating Objects
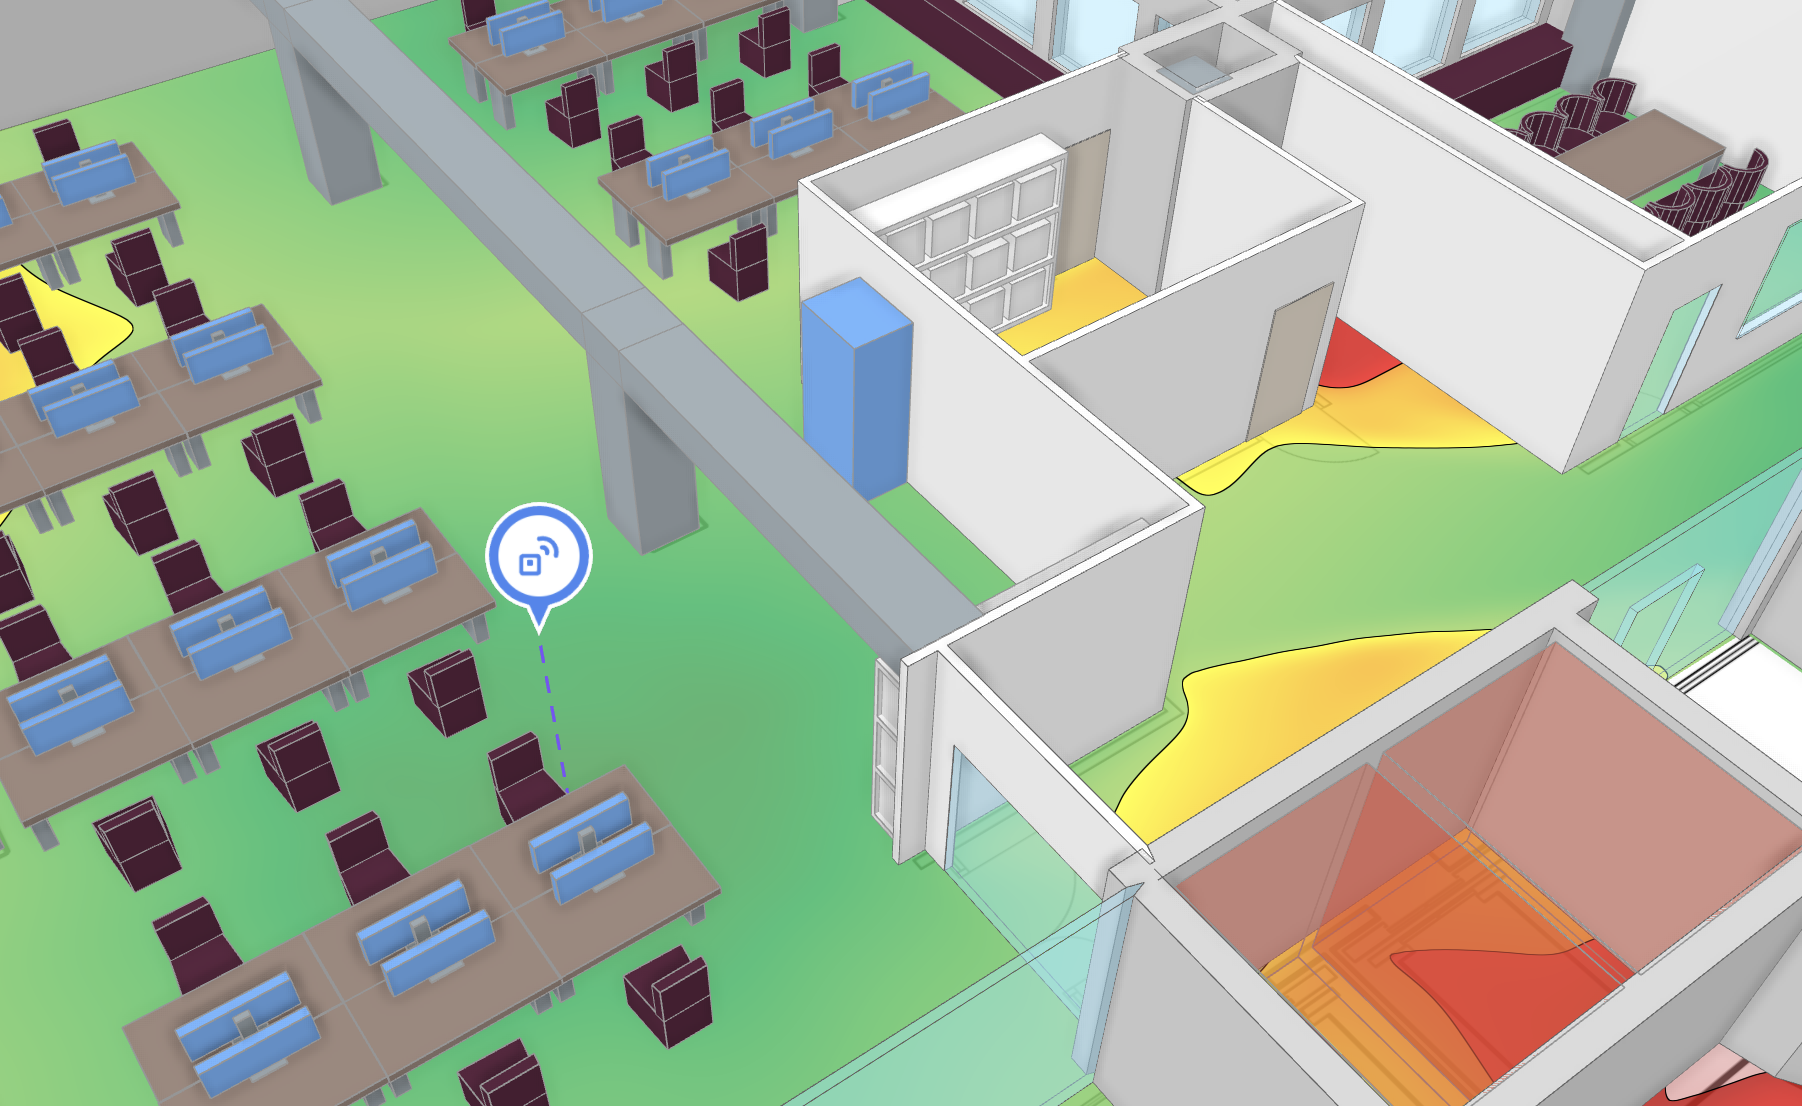
Attenuating Objects are similar to walls in that they create obstacles that reduce signal strength in Hamina. Walls are thin, and knock down signal strength by a pre-determined amount (depending on the wall profile). Attenuating Objects, on the other hand, knock down signal strength depending on how far the signal travels through the object. This makes Attenuating Objects much more suitable for modeling things like warehouse shelving, large machinery, or any other semi-solid non-wall objects.
Use Attenuating Objects to model large obstacles. Don't worry about smaller objects like furniture.
## Drawing Attenuating Objects
### Rectangles
With the left mouse button, click and drag from one corner of the object to the opposite corner, and release the mouse button.
### Free-Form Attenuating Objects
1. Much like drawing walls, **right-click** to begin drawing the attenuating object.
2. **Left-click** to create each node.
3. When the final node has been placed, **right-click** to stop drawing and complete the attenuating object.
{% hint style="success" %}
While drawing attenuating objects, hold down the `Space` bar and move the mouse to pan! Since this panning method doesn't require any mouse clicks, it works great during drawing.
{% endhint %}
### Moving Attenuating Objects
There are two ways to move an Attenuating Object (or group of Attenuating Objects):
* **Method 1**: With the **Edit** tool, **left-click** and **drag** using the edge of the Attenuating Object. *Note: Be careful not to left-click and drag using a point, as this will only move the point.*
* **Method 2**: **Right-click** the edge of the Attenuating Object, and select **Move Zone** from the pop-up toolbar. Move the mouse, and **right-click** again to place the Attenuating Object.
{% hint style="success" %}
Both of these methods also work with groups of objects.
{% endhint %}
## Custom Attenuating Objects
### Measuring Attenuating Objects
You can measure the attenuation of an object in the real world, and use that to define the dB loss per meter for that attenuating object profile in Hamina Network Planner.
1. Set up a 5 GHz access point 3-5 meters away from the object that you would like to measure.
2. Measure the signal strength on the close side of the object.
3. Measure the signal strength on the far side of the object.
4. Measure how many meters it took for the signal to travel through the object.
5. Calculate: (Close side measurement - far side measurement) / distance through the object = dB loss per meter.\
\
Example: (-65 dBm - -75 dBm) / 10 meters = 1 dB loss per meter.
### Adding or Modifying Attenuating Object Profiles
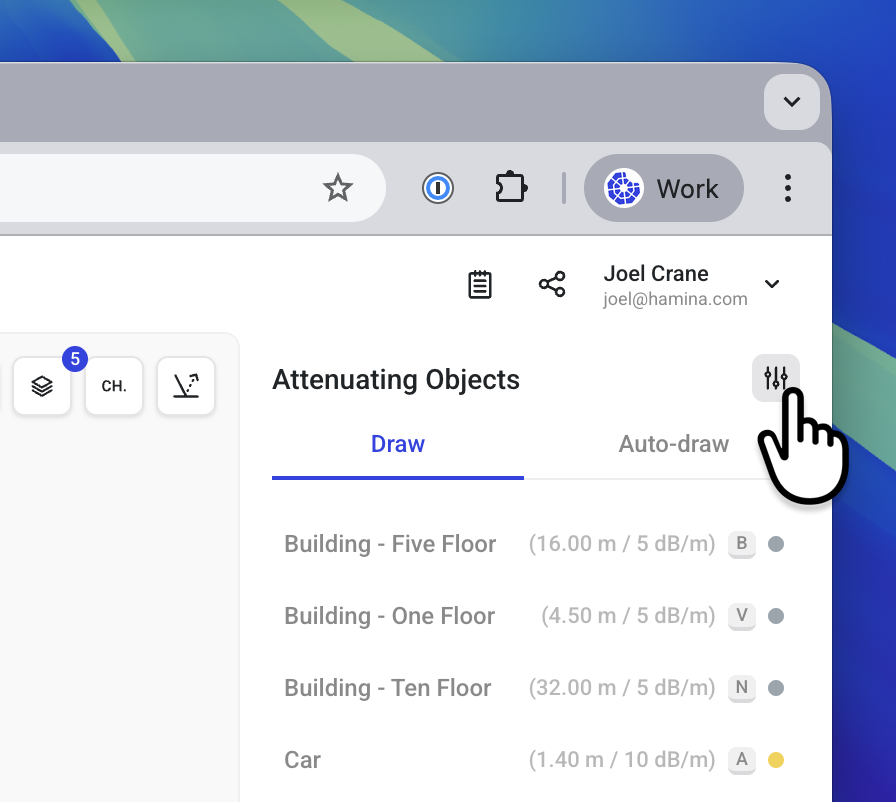
With the Attenuating Objects tool activated, the Attenuating Object pane will appear on the right. Click the **Add or Modify** button at the bottom.
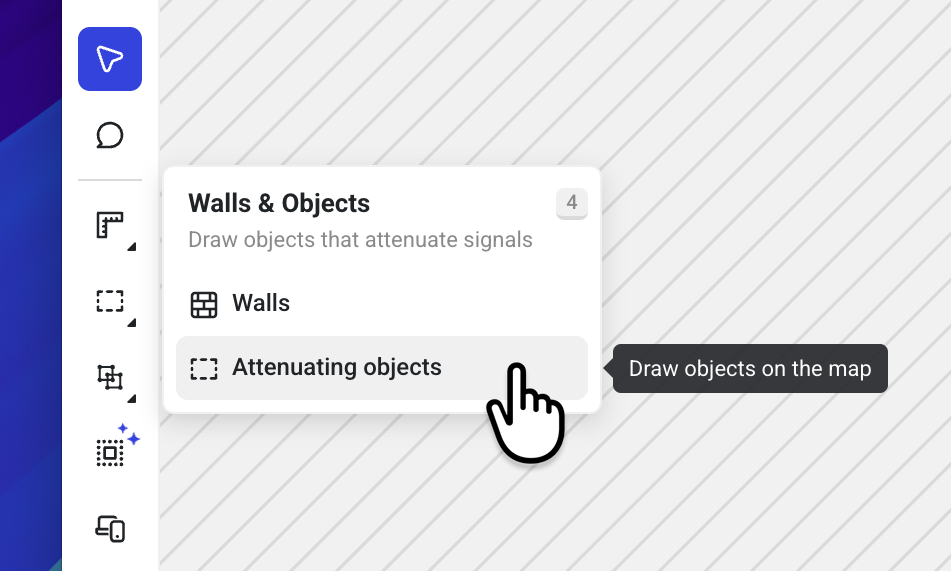
1. In the toolbar, point to the **Walls & Objects** group, and select the **Attenuating Objects** tool.
2. The **Attenuating Objects** pane will appear on the right.
3. In the upper right corner of the Attenuating Objects pane, click on the **Edit Attenuating Object Profiles** button.
4. The **Attenuating Object Type Editor** window will appear.
5. Attenuating Objects profiles can be edited, duplicated (with the **Duplicate** button), or created from scratch (with the **Add a custom type** button).
{% hint style="info" %}
Editing objects only affect the profiles in the project. Your other projects (and any new projects that you create) will be completely unaffected.
{% endhint %}
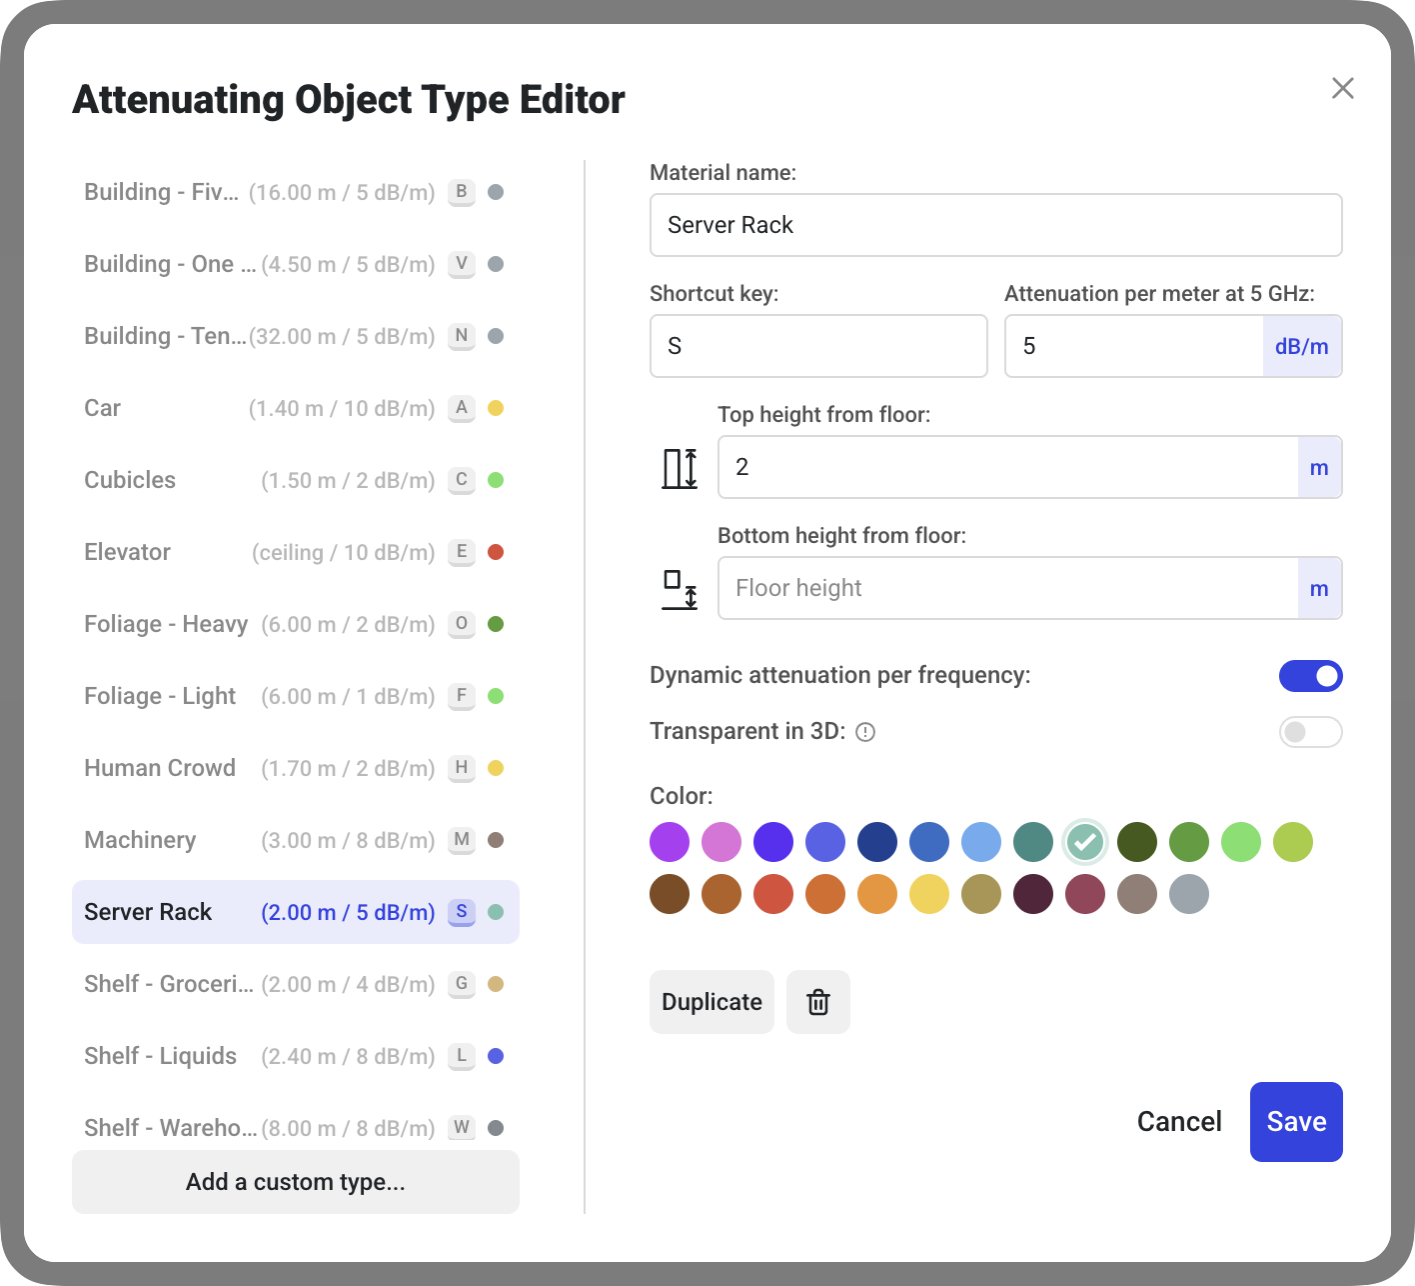
The Attenuating Objects Type Editor offers several options for each Attenuating Object profile:
* **Material name** - The name of the material in Hamina Network Planner. Names that include "Shelf", "Shelving", and "Rack" will receive special shelving styling in 3D. Names that include "Server Rack" will receive special server and communications rack styling in 3D.
* **Shortcut key** - The hotkey that can be used to rapidly select the profile, or switch selected Attenuating Objects to a different profile. Note: A shortcut key can only be used once per project.
* **Attenuation per meter** - How much attenuation is applied to 5 GHz signals on a per-meter basis. Signals that have to travel a longer distance through the object will see more attenuation.
* **Top height from floor** - The total height or top edge of the attenuating object. If left empty, "ceiling height" will be assigned, which is derived from the the height from the floor as defined by the building, or the highest/tallest object on the map, or by the environment type.
* **Bottom height from floor** - Defines the lower edge of the attenuating object. Useful for creating objects that do not rest on the floor.
* **Dynamic attenuation per frequency** - Adjusts the attenuation for other frequency bands such as 2.4 GHz, 6 GHz, or various cellular bands, using the 5 GHz input as a reference point. Hamina Network Planner accepts attenuation per meter at 5 GHz, since 5 GHz Wi-Fi test equipment is readily available. For more information, see [#measuring-attenuating-objects](#measuring-attenuating-objects "mention").
* **Transparent in 3D** - Makes the object transparent when viewing the project in 3D. *Note: Transparency effects muse be enabled in **Settings**.*
* **Color** - Defines the color of the attenuating object in 2D and 3D.
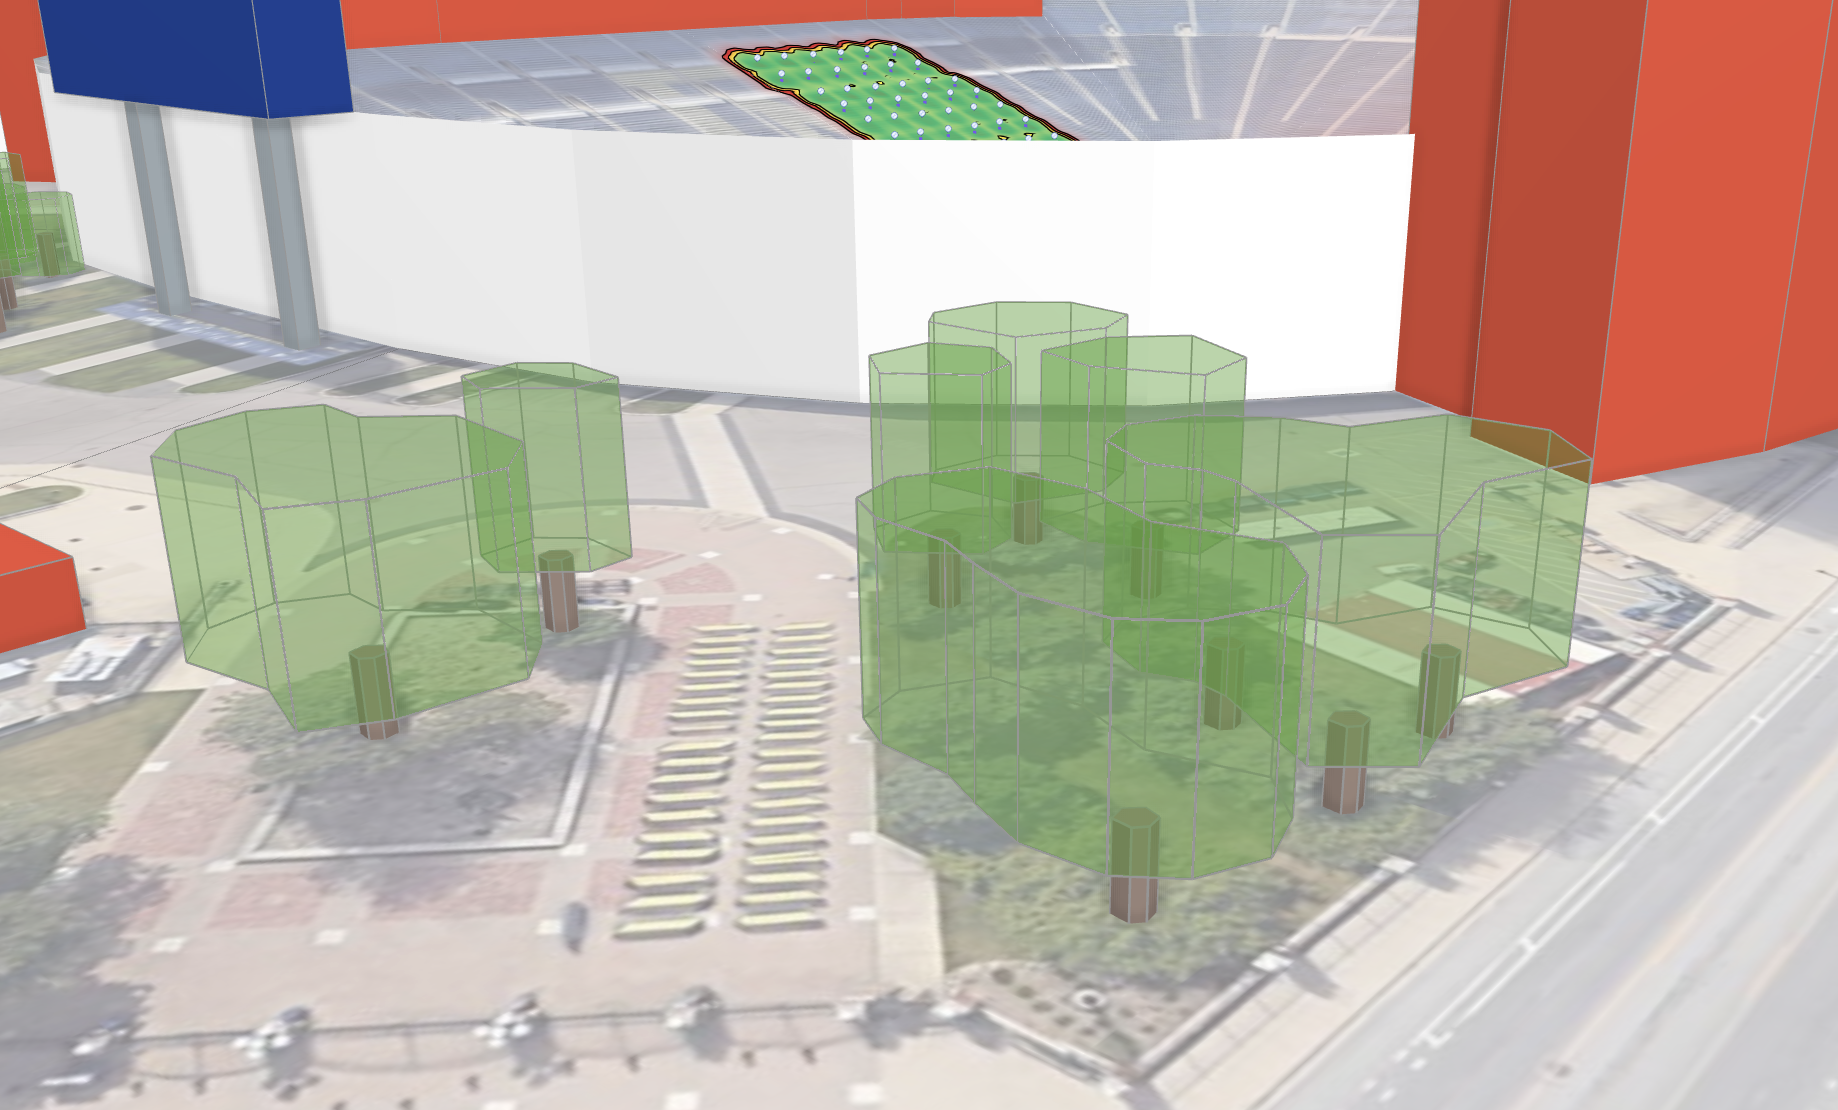
#### Creating Complex Objects
It's possible to use multiple Attenuating Objects layered on each other to create objects, such as trees.
While perhaps not necessary for Wi-Fi design, multiple Attenuating Objects can be combined to create complex 3D geometry, such as office furniture. In these scenarios, we recommend setting the **Attenuation per meter** to 0 dB.
#### Copying Attenuating Objects to Other Projects
Attenuating Objects can be copied and pasted to other projects.
1. Using the **Edit** tool, select the Attenuating Object or group of Attenuating Objects.
2. Press either ⌘ + C or Ctrl + C to copy them to your clipboard.
3. Switch to the new project and press ⌘ + V or Ctrl + V to paste them in the map. *Note: You might need to zoom out to find where the object was pasted, as it will paste to similar X/Y coordinates in the new project.*
{% hint style="info" %}
If the pasted Attenuating Object contains any new Attenuating Object profiles, they will be added to the profiles list. This can be useful for transporting not just Attenuating Objects to a map, but for simply copying a profile to another project.
{% endhint %}
#### Saving Attenuating Objects Outside of Hamina
When copying and pasting an Attenuating Object, or multiple Attenuating Objects to the clipboard, they are saved to the clipboard as JSON. This can be pasted in any text editor or snippet tool for later retrieval, either as a way to quickly populate a project with Attenuating Objects, or Attenuating Object Profiles.
Here's an example of a tree, composed of two Attenuating Objects, that you can copy and paste into a test project:
{% code expandable="true" %}
```json
{
"header": {
"type": "HaminaClipboard",
"version": [
1,
0,
0
],
"id": "7a34d05b-e356-41fd-ab9b-e192897f6665"
},
"walls": [],
"wallEndpoints": [],
"wallTypes": [],
"cableTrays": [],
"cableTrayEndpoints": [],
"attenuatingZones": [
{
"typeId": "4130e51b-69aa-43b2-ae22-748e7ab9586a",
"area": {
"type": "Polygon",
"coordinates": [
[
[
26.74557572129958,
-16.926916784376463
],
[
23.600488351193167,
-17.481932202630535
],
[
22.767965223812062,
-20.3495118636099
],
[
22.767965223812062,
-20.3495118636099
],
[
24.89552432711934,
-23.309594094298276
],
[
24.89552432711934,
-23.309594094298276
],
[
28.225616836643756,
-23.40209666400729
],
[
28.225616836643756,
-23.40209666400729
],
[
30.075668230824014,
-21.274537560700022
],
[
30.075668230824014,
-21.274537560700022
],
[
29.890663091405976,
-19.239481027101757
]
]
]
}
},
{
"typeId": "df285782-4082-4ece-b243-214d7aa3e358",
"area": {
"type": "Polygon",
"coordinates": [
[
[
26.74337070258618,
-19.86422049055036
],
[
26.01216906742072,
-20.47996923595286
],
[
26.127621957183685,
-21.249655167705985
],
[
27.20518226163805,
-21.17268657453068
],
[
27.20518226163805,
-20.51845353254052
]
]
]
}
}
],
"attenuatingZoneTypes": [
{
"id": "4130e51b-69aa-43b2-ae22-748e7ab9586a",
"name": "Tree Foliage",
"color": "#509D33",
"shortcutKey": "f",
"topEdge": 12.192148256522799,
"bottomEdge": 6.0960741282613995,
"attenuationDbPerMeter": 1,
"ituRModelEnabled": true,
"transparencyEnabled": true
},
{
"id": "df285782-4082-4ece-b243-214d7aa3e358",
"name": "Tree Trunk",
"color": "#937E75",
"shortcutKey": "z",
"topEdge": 9.1441111923921,
"bottomEdge": null,
"attenuationDbPerMeter": 10,
"ituRModelEnabled": true,
"transparencyEnabled": false
}
],
"scopeZones": [],
"capacityZones": [],
"holeInFloorZones": [],
"accessPoints": [],
"mapNotes": [],
"tiePoints": [],
"cableRisers": [],
"clientDevices": [],
"networkInfraDevices": [],
"raisedFloorZones": [],
"slopedFloors": []
}
```
{% endcode %}